The essentials at a glance.
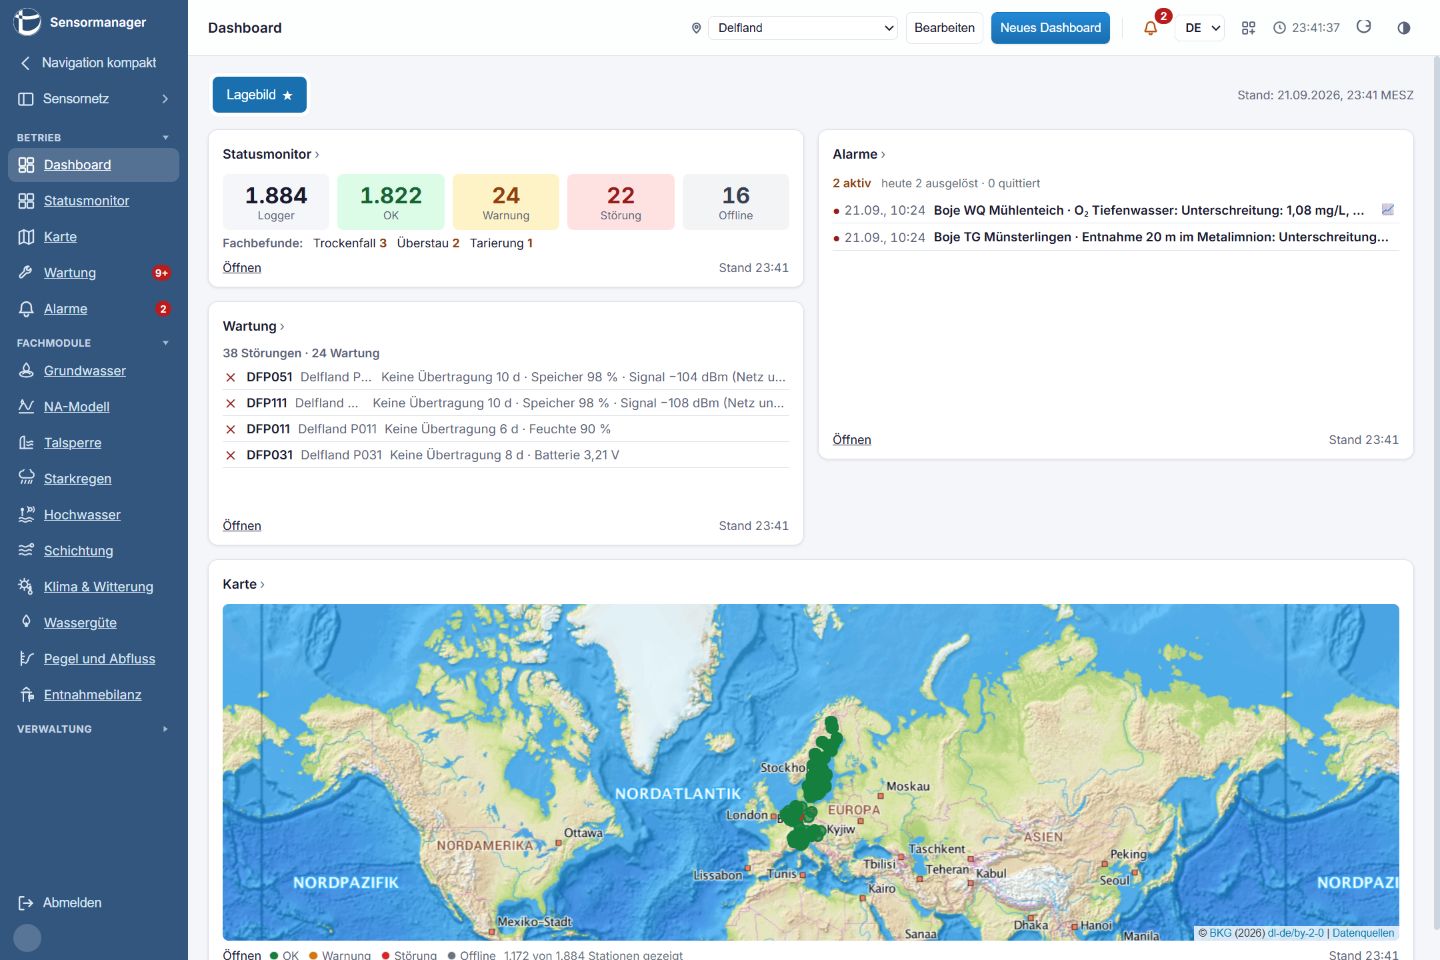
The dashboard brings status, alarms, maintenance and the map together in a personal overview, helping you find your next task.

The new Sensormanager connects your monitoring network with specialist analysis and field work. Explore the new interface, from groundwater contour maps to mobile maintenance.
Already in use with initial test customers. General availability will follow at a later date.
Actual views of the new interface with simulated example data. No customer data. Features and appearance may change before release. Screenshots show the German interface.
This is how the new Sensormanager presents your monitoring network in presentation mode: groundwater contours in time-lapse, the radar gauge during flood and drought, the reservoir in cross-section, the control room view, and climate and water quality as tiles. The show runs by itself – as soon as you touch a control, you take over.
Browser demo with simulated time series – no customer data, no official values. Flow directions are shown schematically. In Sensormanager the same views are calculated from your real monitoring stations.
From day-to-day operations and specialist analysis to documentation, Sensormanager brings the tasks around your monitoring network together.
Dashboard, status monitor, map, maintenance and alarms lead from an overview to the task at hand. Time series reveal temporal relationships, while mobile maintenance supports field work.
Select a view to explore the operation of your monitoring network.
Explore mobile maintenance →The dashboard brings status, alarms, maintenance and the map together in a personal overview, helping you find your next task.
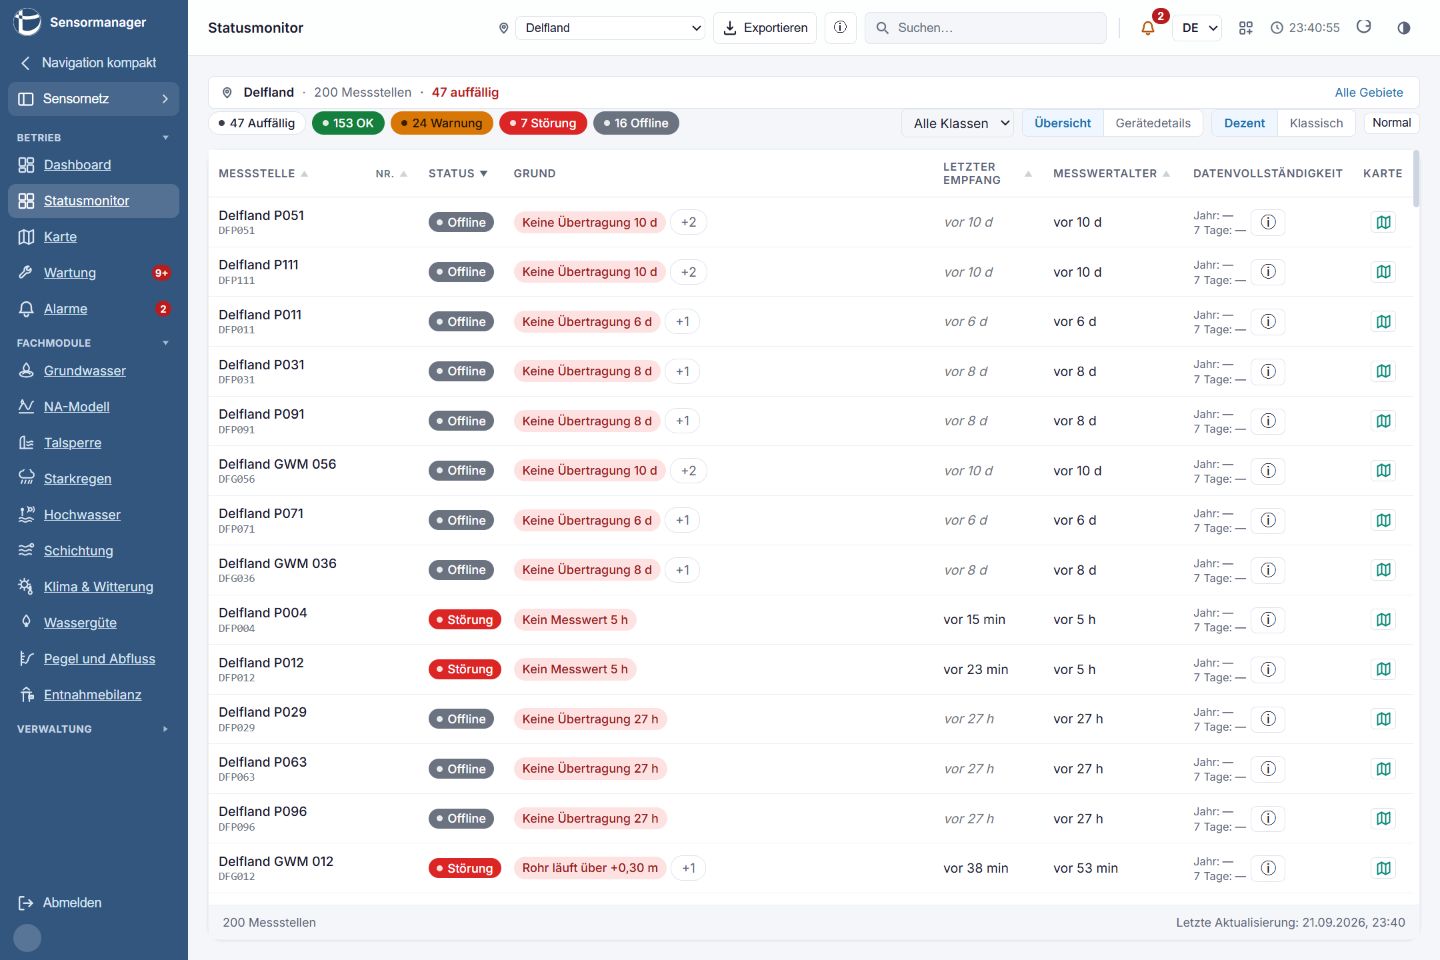
The status monitor shows device condition, last transmission and the age of measurements. Issues and their causes help you prioritise the next steps.
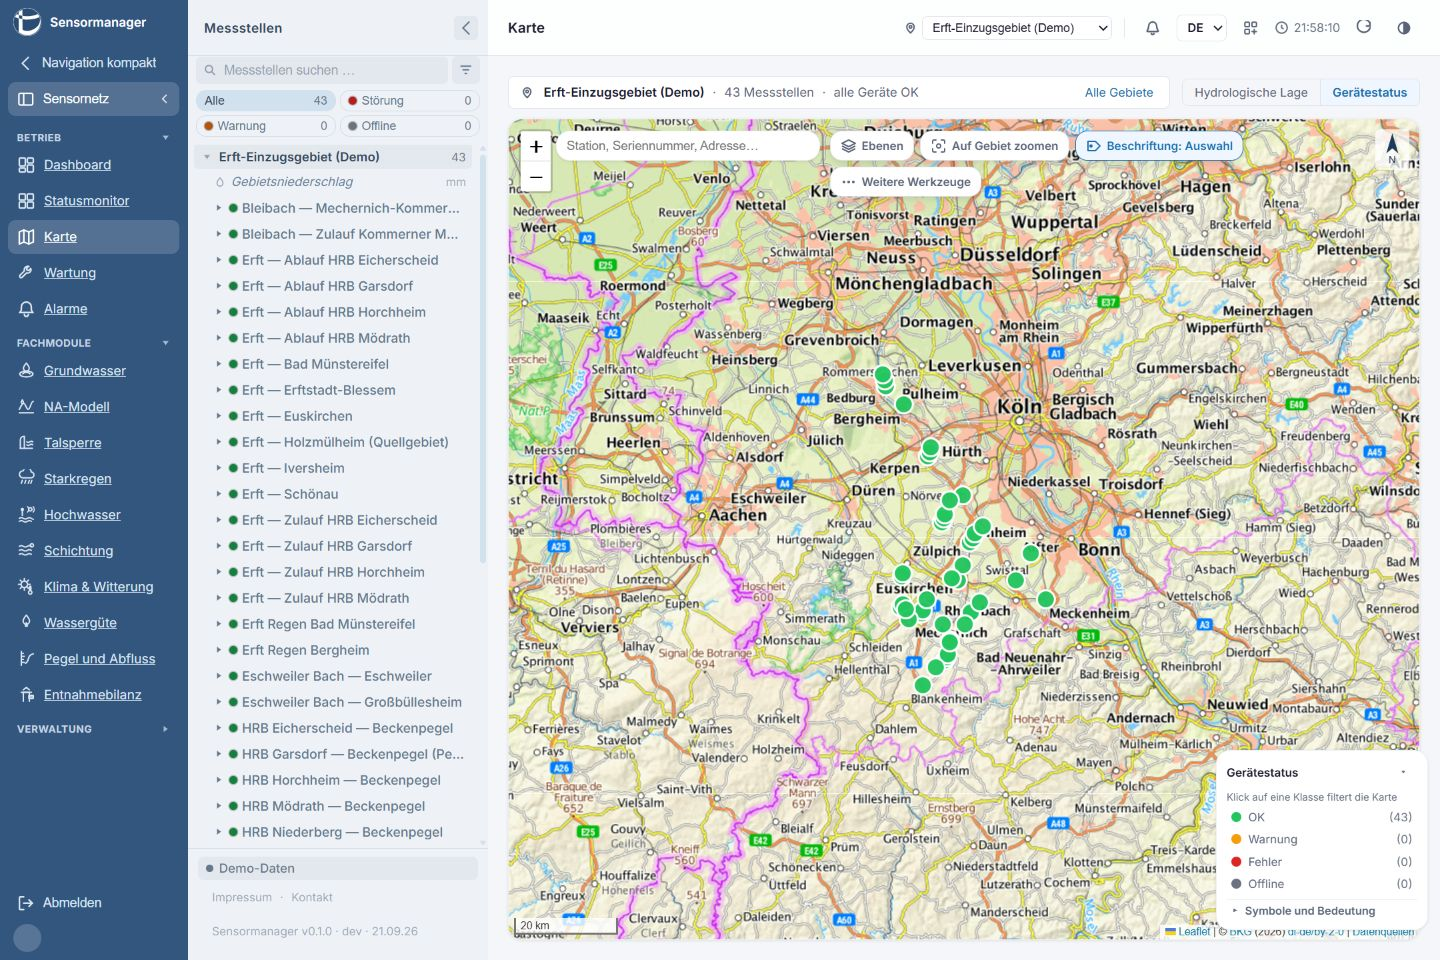
Locate monitoring stations on the map and move from the overview to an individual station to explore their spatial context.
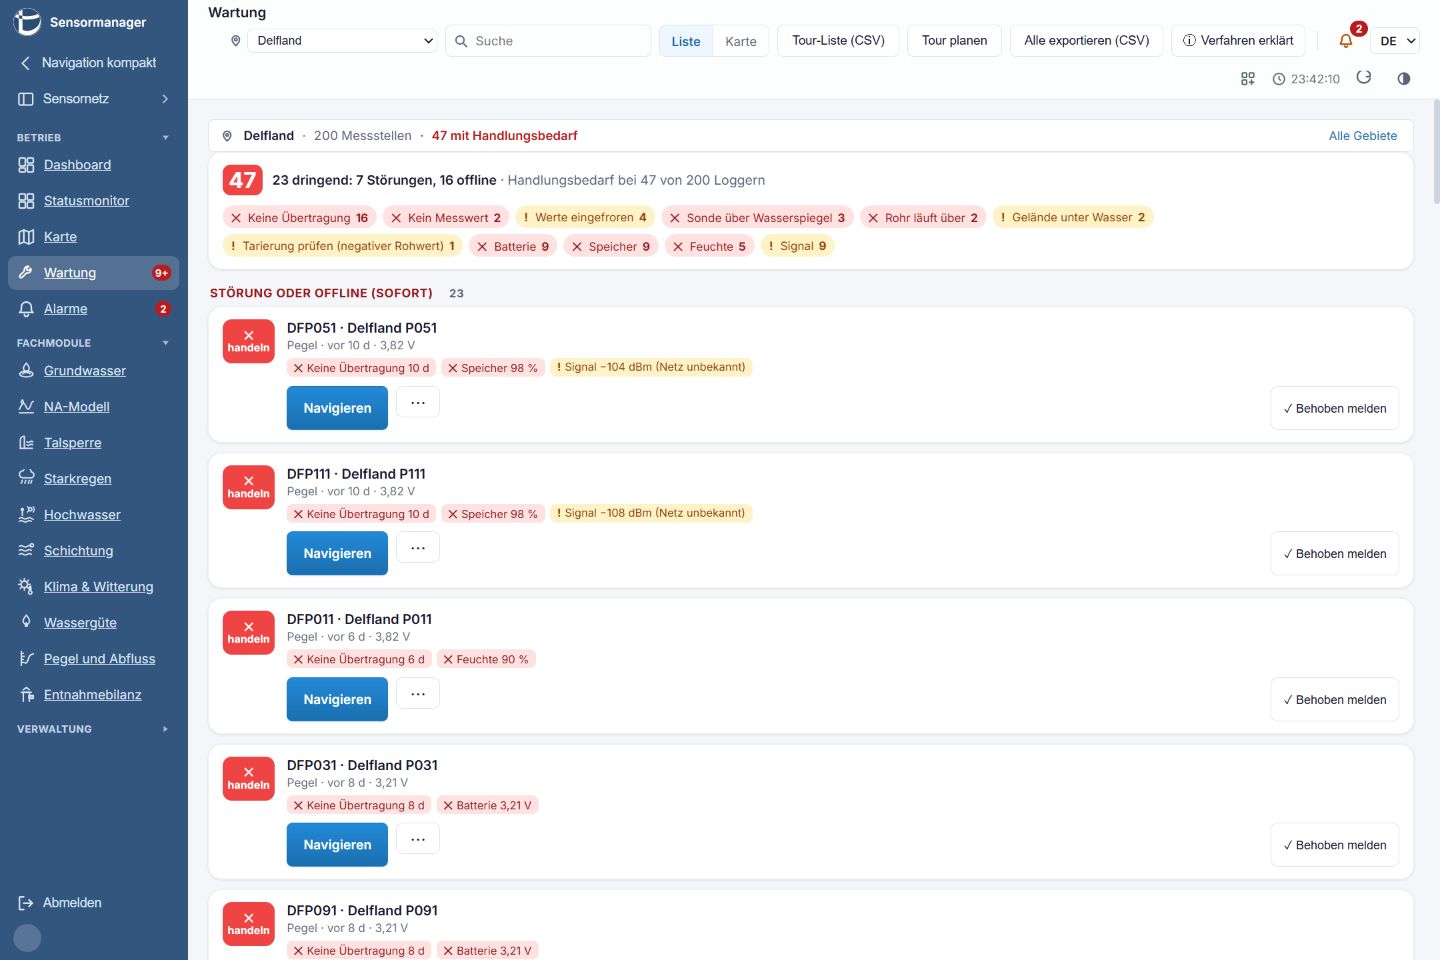
Review findings by urgency, prepare tours and navigate to a monitoring station. Maintenance is also optimised for mobile devices.
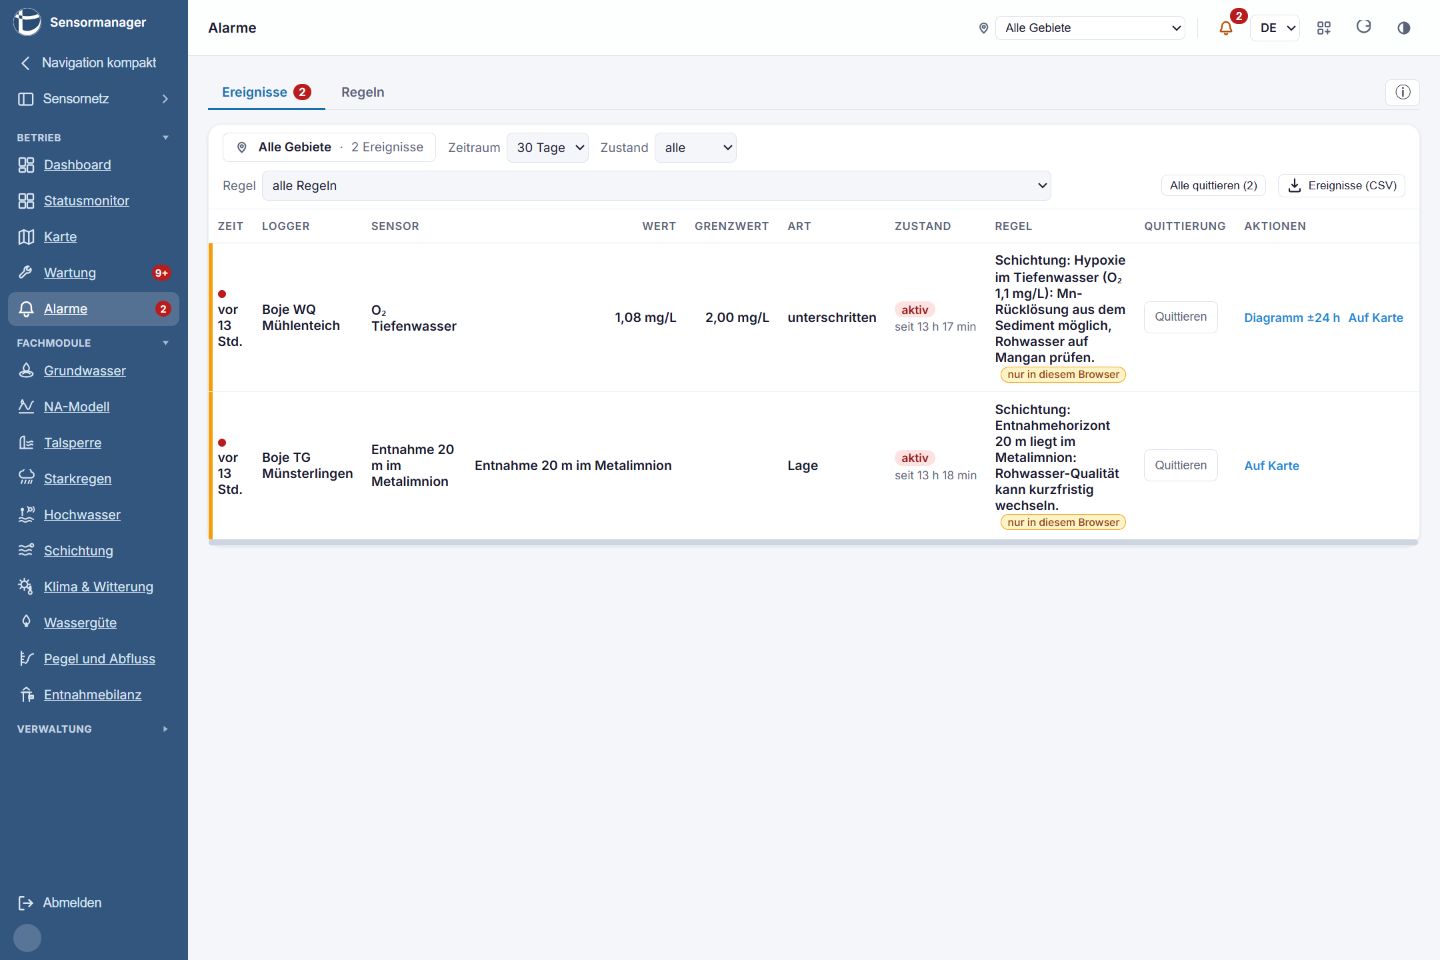
Review threshold violations alongside the measurement, rule and event status. The event overview helps you assess alarms and follow their handling.
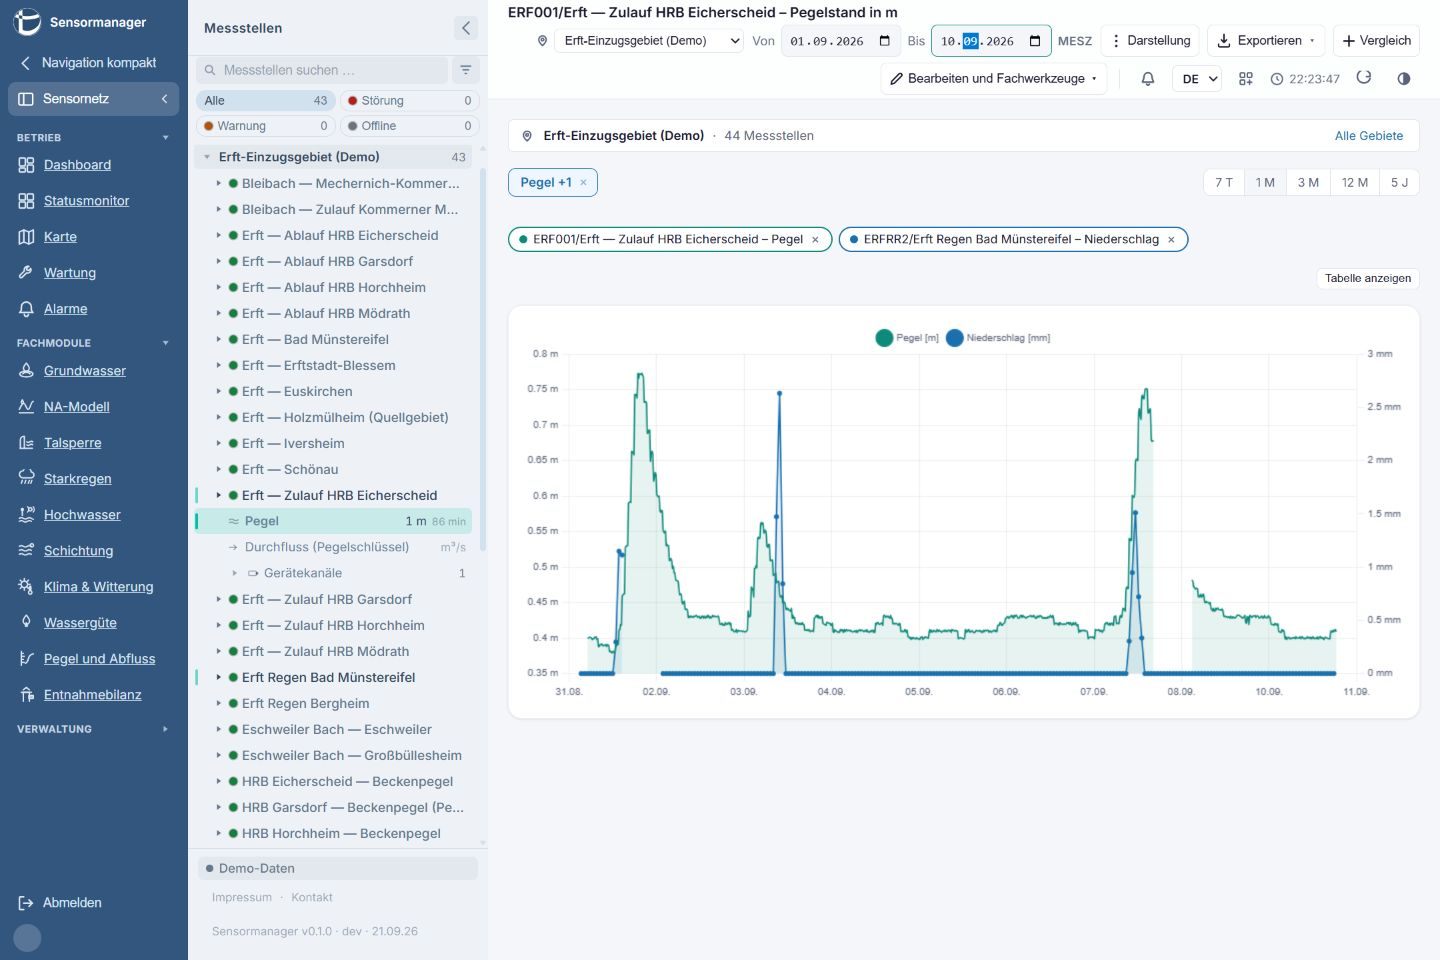
Compare time series of different variables to reveal temporal relationships between rainfall, water levels and other measurements.
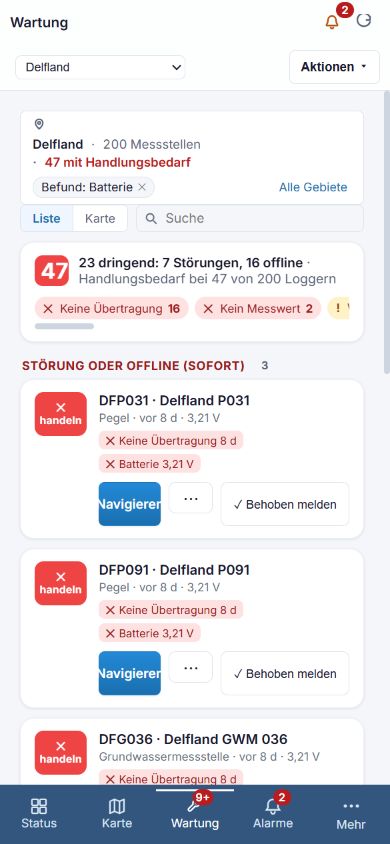
Optimised for mobile devices: field technicians can see which stations need attention while on the move. Prioritise findings, prepare visits and navigate directly to a station in a clear mobile view.
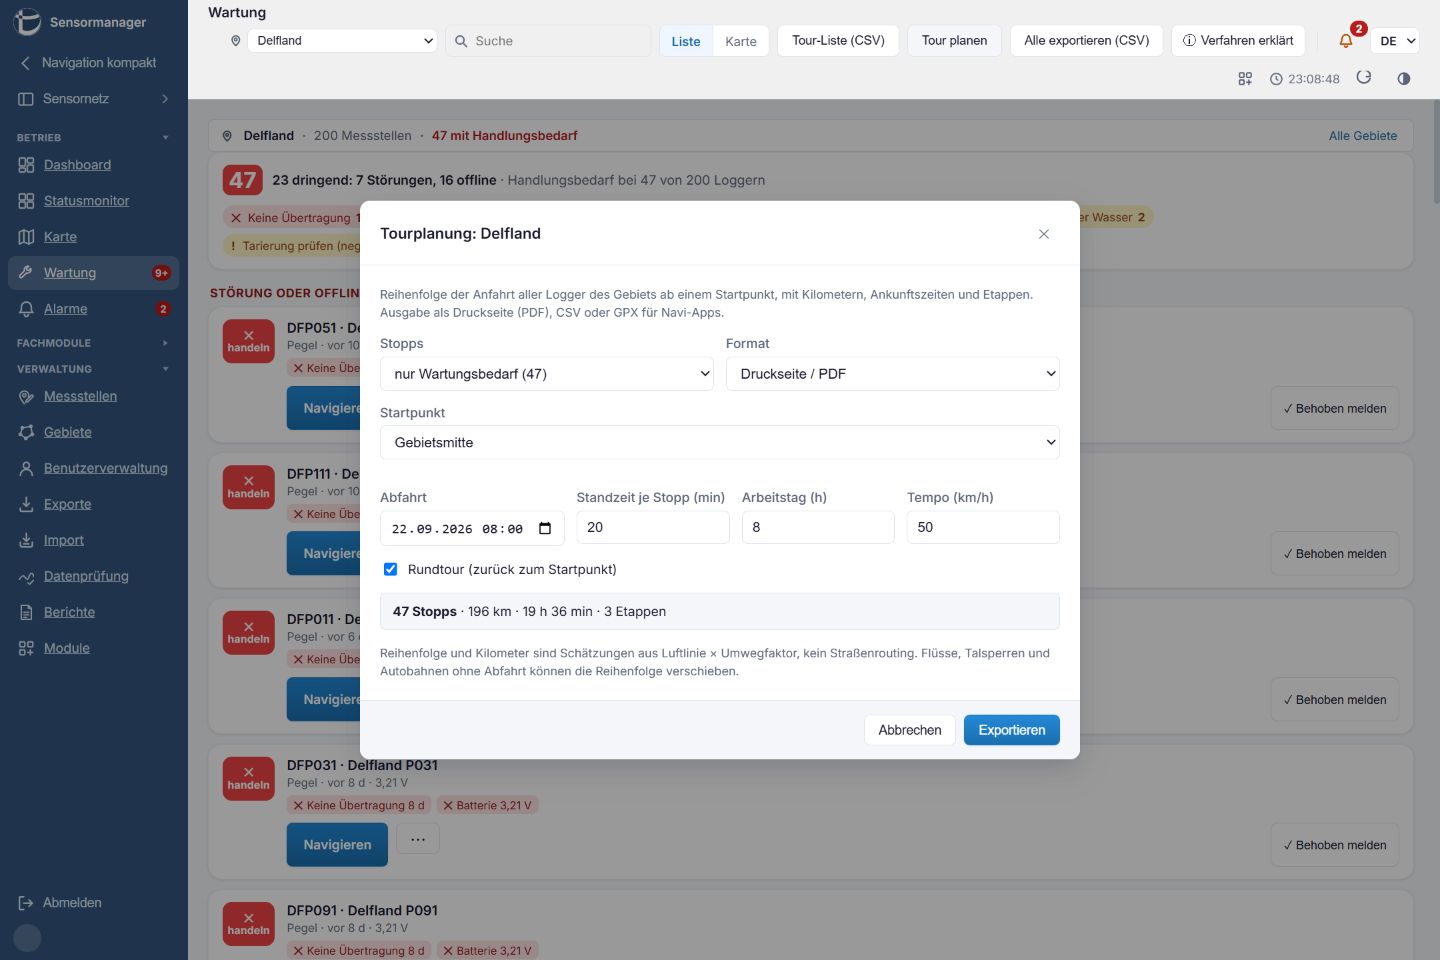
Tour distances and times are estimates; planning does not replace road routing.
The Sensormanager brings your monitoring network together in the office. For work on the individual device there is the Aquatos Field app: it connects your smartphone to the Aquatos logger via Bluetooth. You measure and tare right at the monitoring site and read out stored data.
Explore Aquatos Field →Free of charge for all users of TerraTransfer devices. On iPhone and iPad in the Bluefy browser.
Ten specialist modules complement operations – from groundwater contour maps to abstraction balances. Choose a module to see what it calculates, which parameters it needs and which TerraTransfer equipment fits.
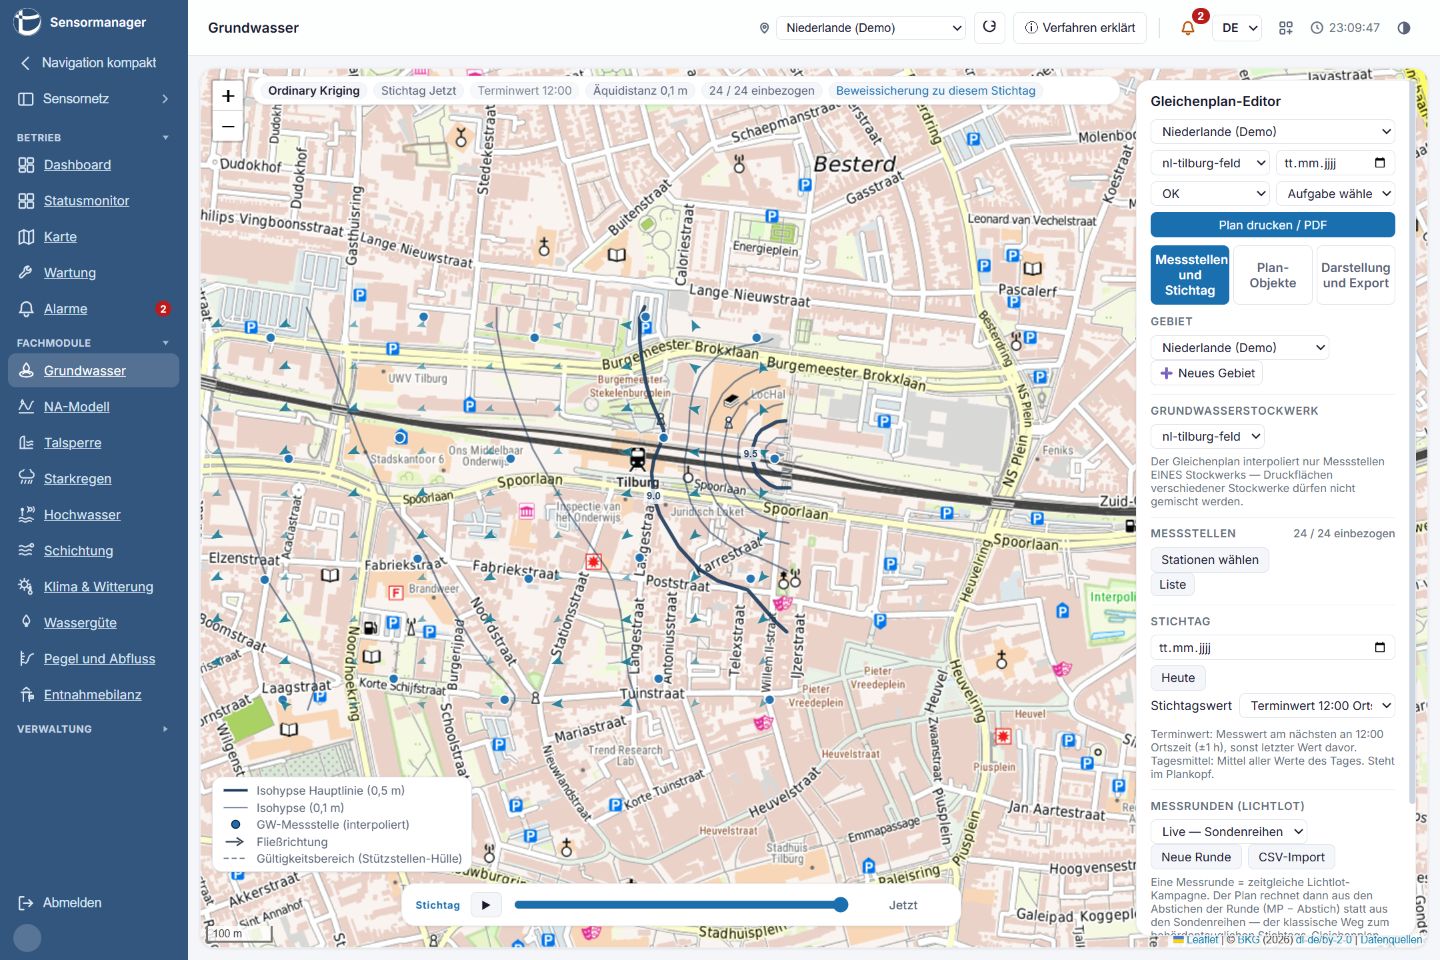
Individual monitoring wells become a spatial picture: groundwater contours for a reference date, difference maps between two dates and depth to water from the terrain model. Flow direction and gradient are derived from the interpolated surface.
What the module does
Required parameters
Matching equipment
Reports
The module takes you from the permit to the annual declaration: assign abstraction points, set up monitoring and keep track of the permitted volumes at all times – with a projection to the end of the year.
What the module does
Required parameters
Matching equipment
Reports
Water level becomes discharge: rating curves with versions and validity periods, discharge measurements for comparison and a low-flow overview with flow duration curve and drought context.
What the module does
Required parameters
Matching equipment
Reports
The flood overview brings together all gauges in a catchment: alert level, trend and data age at a glance, plus a 48-hour forecast with uncertainty band and the time until the next level.
What the module does
Required parameters
Matching equipment
Reports
A conceptual rainfall–runoff model runs alongside your gauge every hour and calibrates itself in the background. The result is a 48-hour forecast with uncertainty band – including a quality record.
What the module does
Required parameters
Matching equipment
Beta · The forecast is not an official warning.
Storage, flood retention and release in context: the overview shows water level, storage, fill level, inflow and release, and derives the retention readiness with a release stage.
What the module does
Required parameters
Matching equipment
Reports
Classify heavy rain in space and time: every rain gauge is assessed over eleven durations using KOSTRA-DWD-2020, and events can be replayed as a map animation – complemented by a radar nowcast.
What the module does
Required parameters
Matching equipment
Reports
KOSTRA is available for sites in Germany; hazard areas are not official.
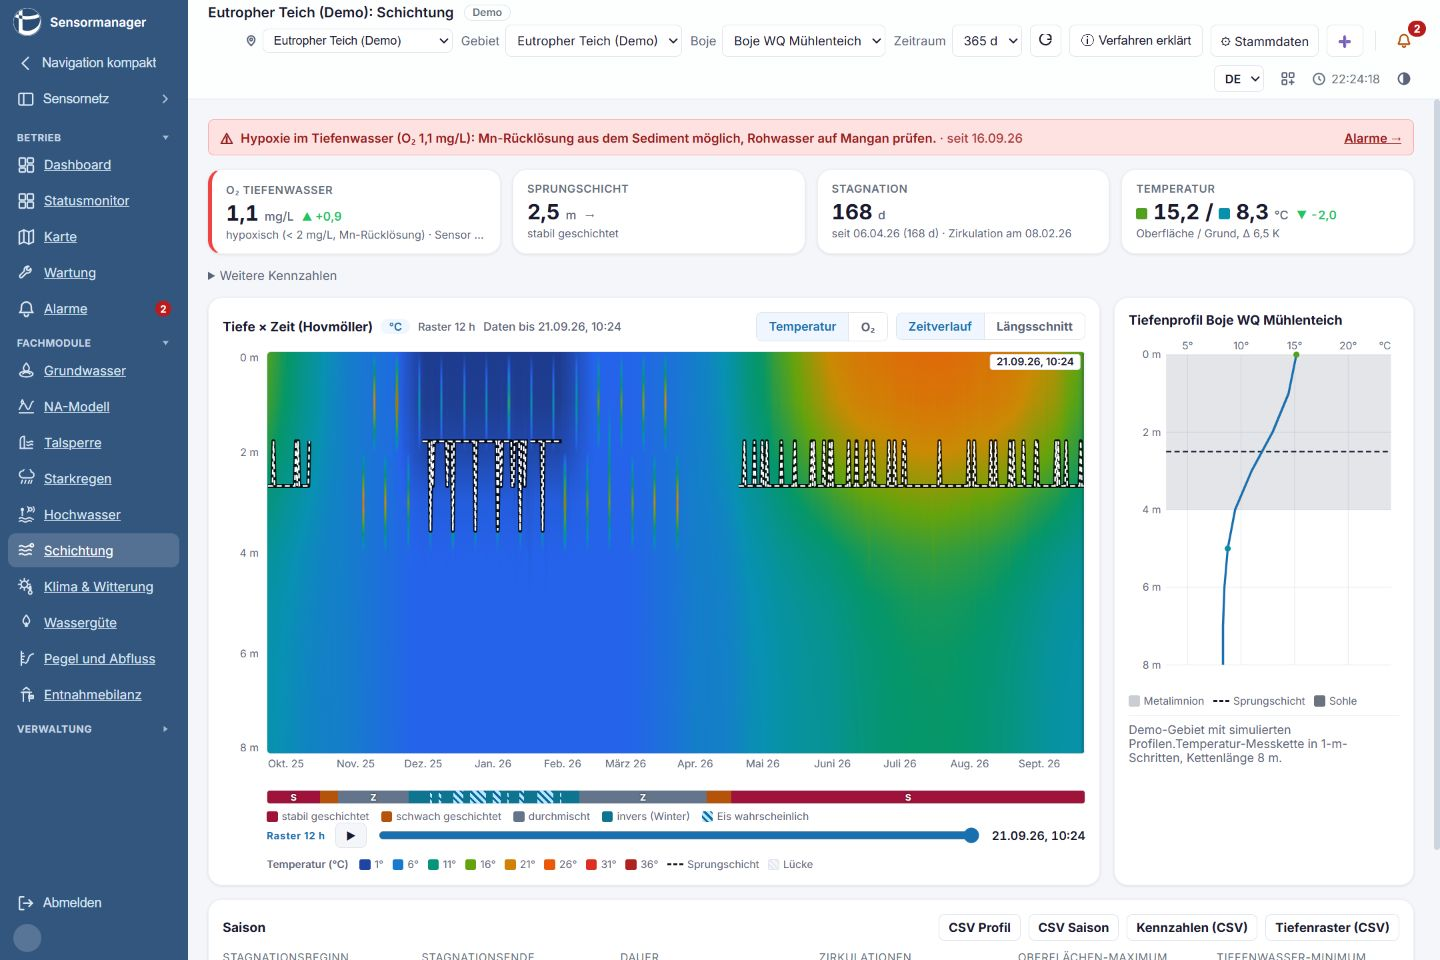
How do temperature and oxygen change with depth and time? The module detects the thermocline and stagnation and estimates when critical oxygen levels will be reached in the deep water.
What the module does
Required parameters
Matching equipment
Without oxygen sensors, oxygen is modelled and labelled as such.
View and classify different quality parameters together: map with traffic lights, assessment against the relevant regulation and time series – from rivers to raw drinking water.
What the module does
Required parameters
Matching equipment
Assessment close to German LAWA practice; not a substitute for official classification.
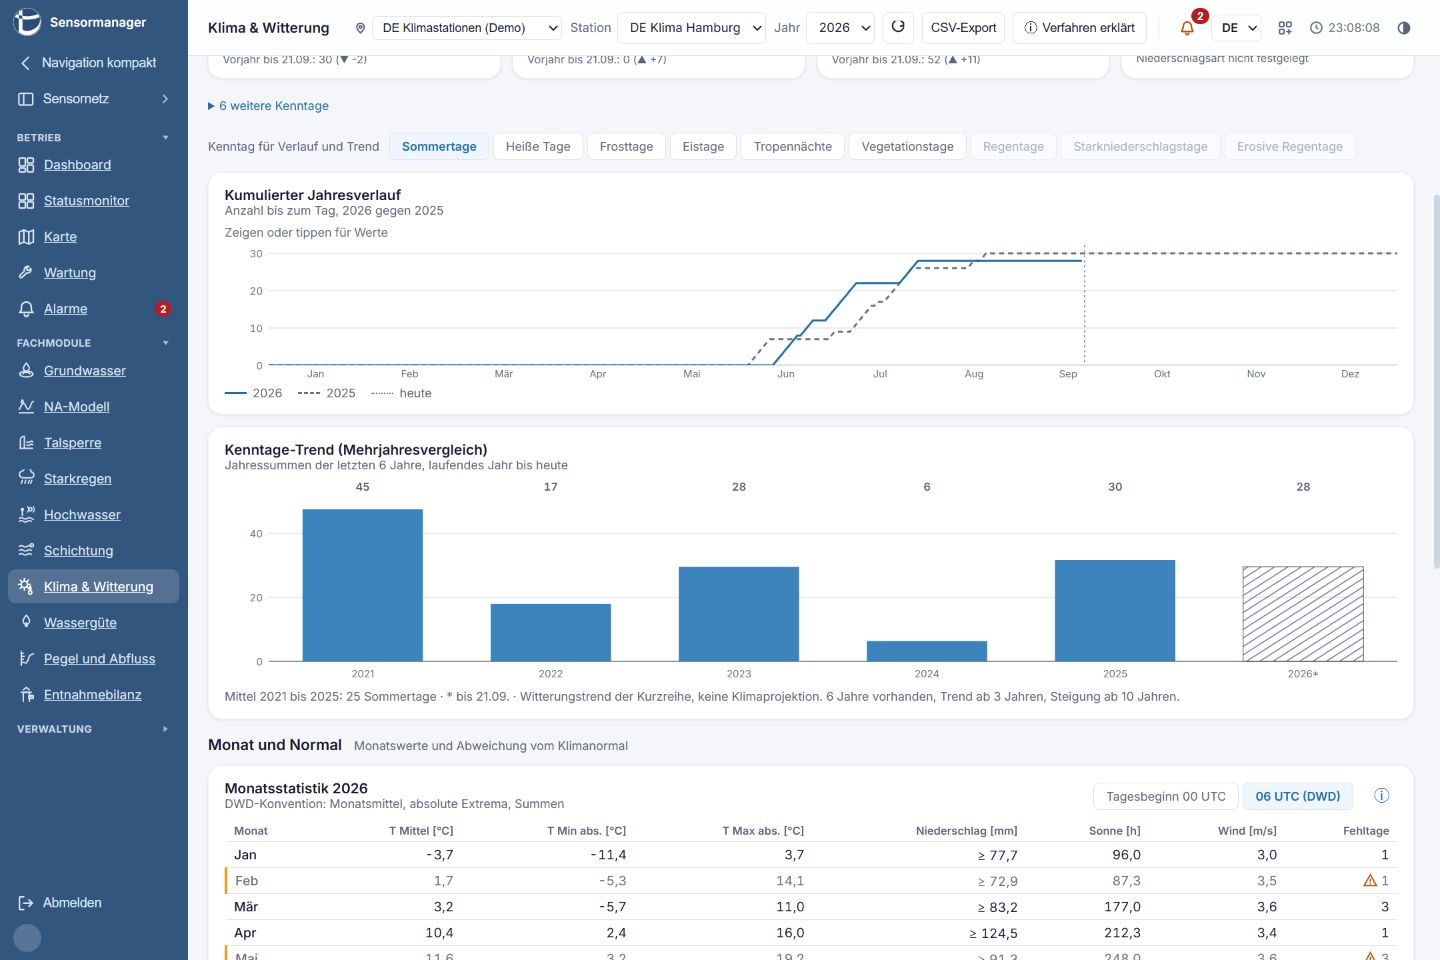
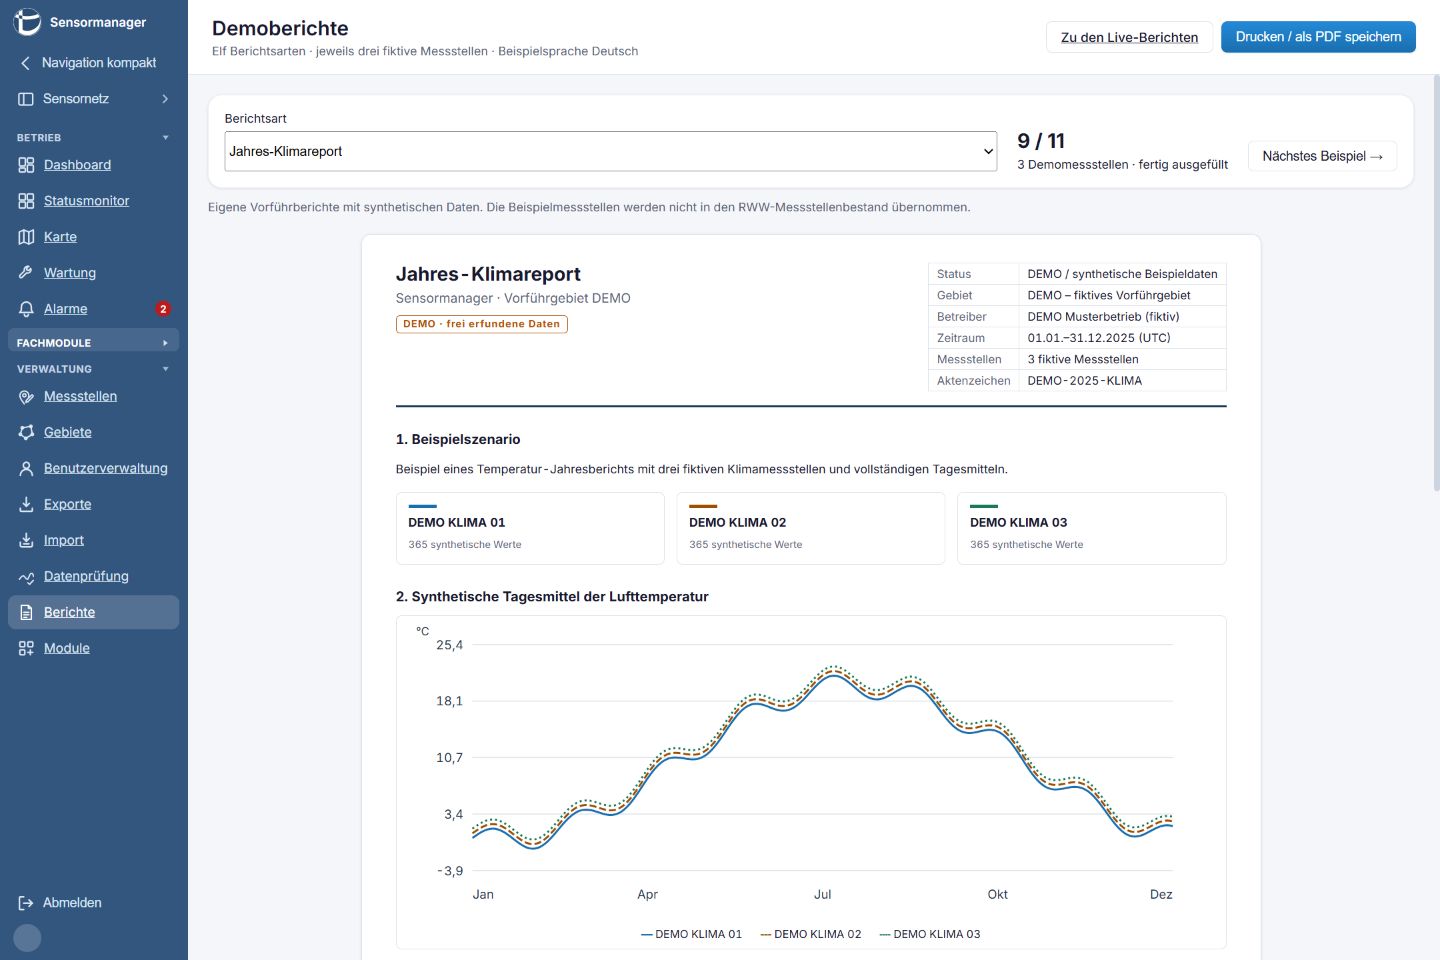
How is the current year developing? Climate index days, monthly statistics and the comparison with the 1991–2020 climate normal show it – complemented by the climatic water balance and drought indices.
What the module does
Required parameters
Matching equipment
Reports
Short series describe the weather; climate statements need at least 30 years.
Preview of the current development stage. Available analyses depend on measurement data, configuration and activation of the relevant module. Forecasts and assessments support decisions; they are not official warnings or expert reports.
Individual monitoring points become a spatial picture: groundwater contours connect points of equal hydraulic head on a selected date. Flow arrows illustrate the gradient derived from the interpolated surface.
The map interpolates between monitoring points. Its reliability depends on factors including station density, elevation reference and hydrogeological conditions.
How does this year compare with the previous one? The climate and weather module brings together threshold-day counts, annual curves and monthly statistics, including summer, hot and frost days.
Short measurement series describe weather patterns. Long-term climate conclusions require a suitably long and appropriate dataset.
The stratification module shows how measurements change with depth and time, for example in lakes and ponds.
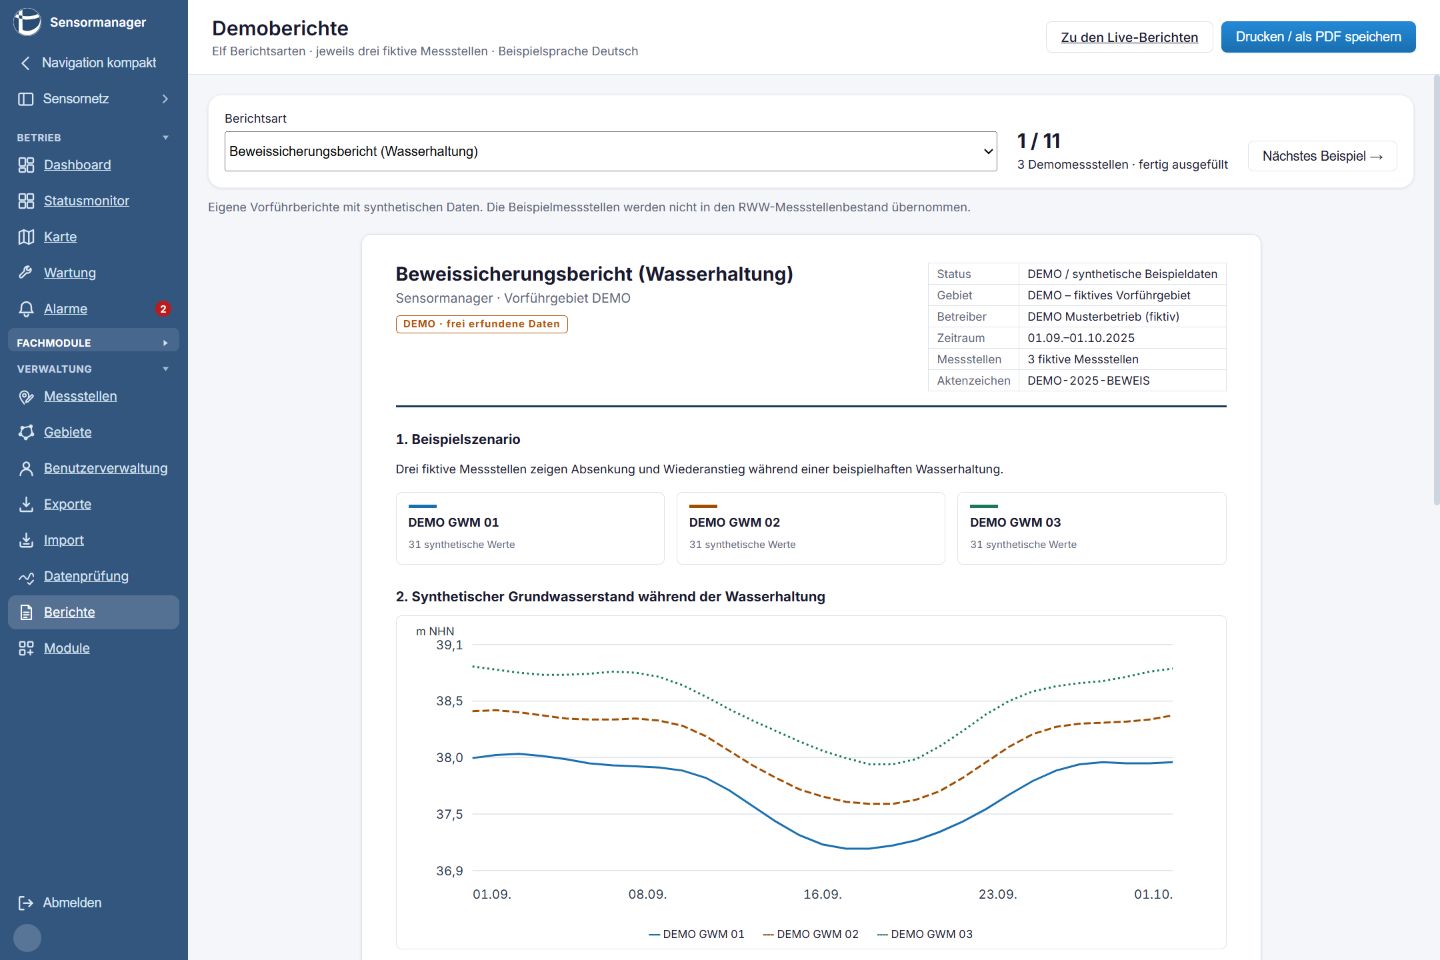
Administration brings together stations, areas, users, data exchange, data review and reports, keeping the path from station metadata to analysis clear.
Stations · Areas · User management
Import · Exports · Data review
Reports · Module management
Eleven report types support different tasks. This preview shows how time series, statistics and station metadata come together in understandable reports. Reports can be saved as PDFs using the print view.
Would you like to see how the new interface fits your monitoring network? We can show you the current version and discuss your requirements and a potential transition.
Request a personal preview →Continue using your existing access until your transition has been agreed. Contact us to discuss the change and the availability of individual modules.
Contact the team →Manuals and downloads →