The right parameters.
Oxygen, pH, conductivity and turbidity provide different insights. Additional sensors are chosen for the measurement objective and location.

Understand what changes in the water. Monitor water quality continuously with suitable probes, monitoring stations and clear data analysis.
Sensors, data loggers and analysis work together as a system. The equipment is selected for your measurement task and location.
Oxygen, pH, conductivity and turbidity provide different insights. Additional sensors are chosen for the measurement objective and location.
Probes, logger and power supply are matched to each other. Depending on the water body, installation uses a fixed station or a monitoring buoy.
Time series reveal fluctuations. Pollutant loads also require suitable concentration and discharge data.
A look at real installations: mounting is part of the solution, along with sensors, power and access to data.
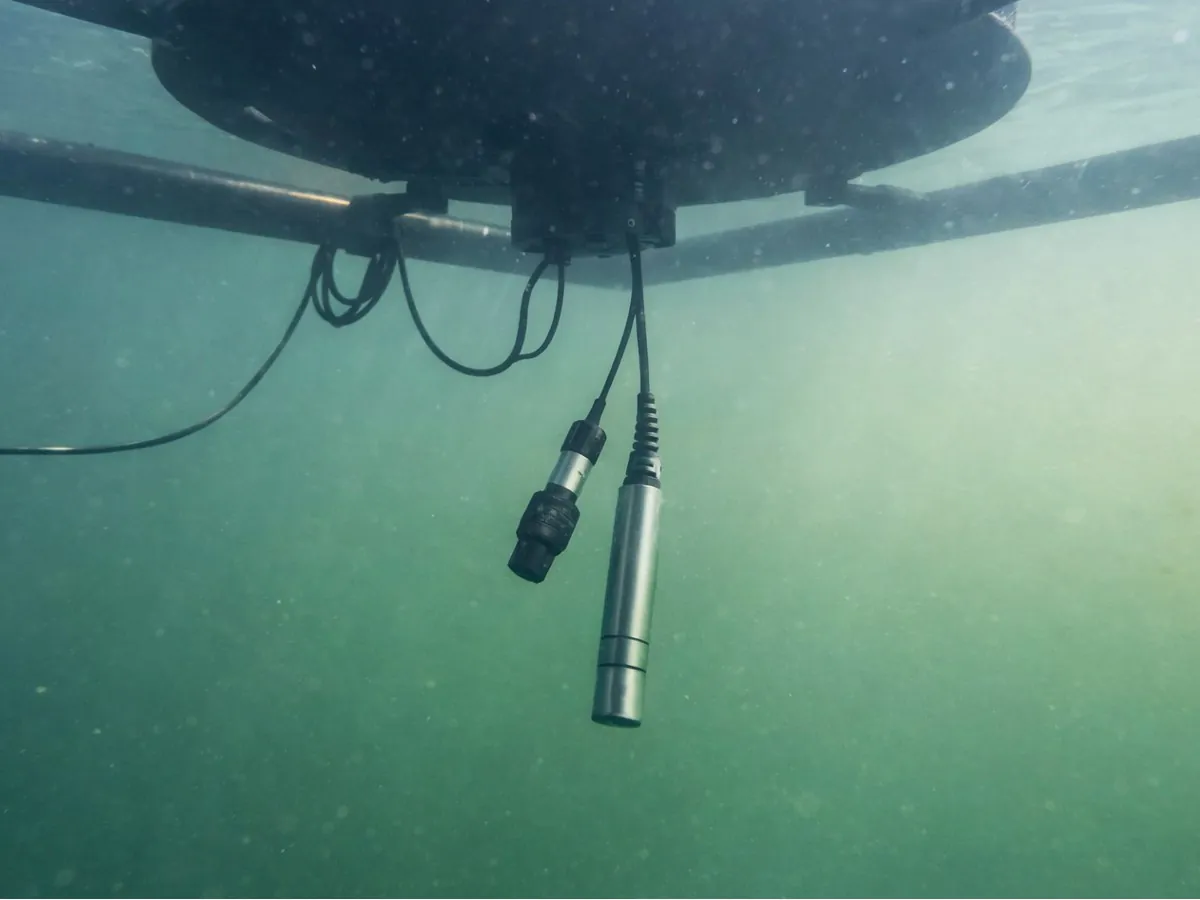
Sensors mounted beneath a monitoring buoy, directly in the water.
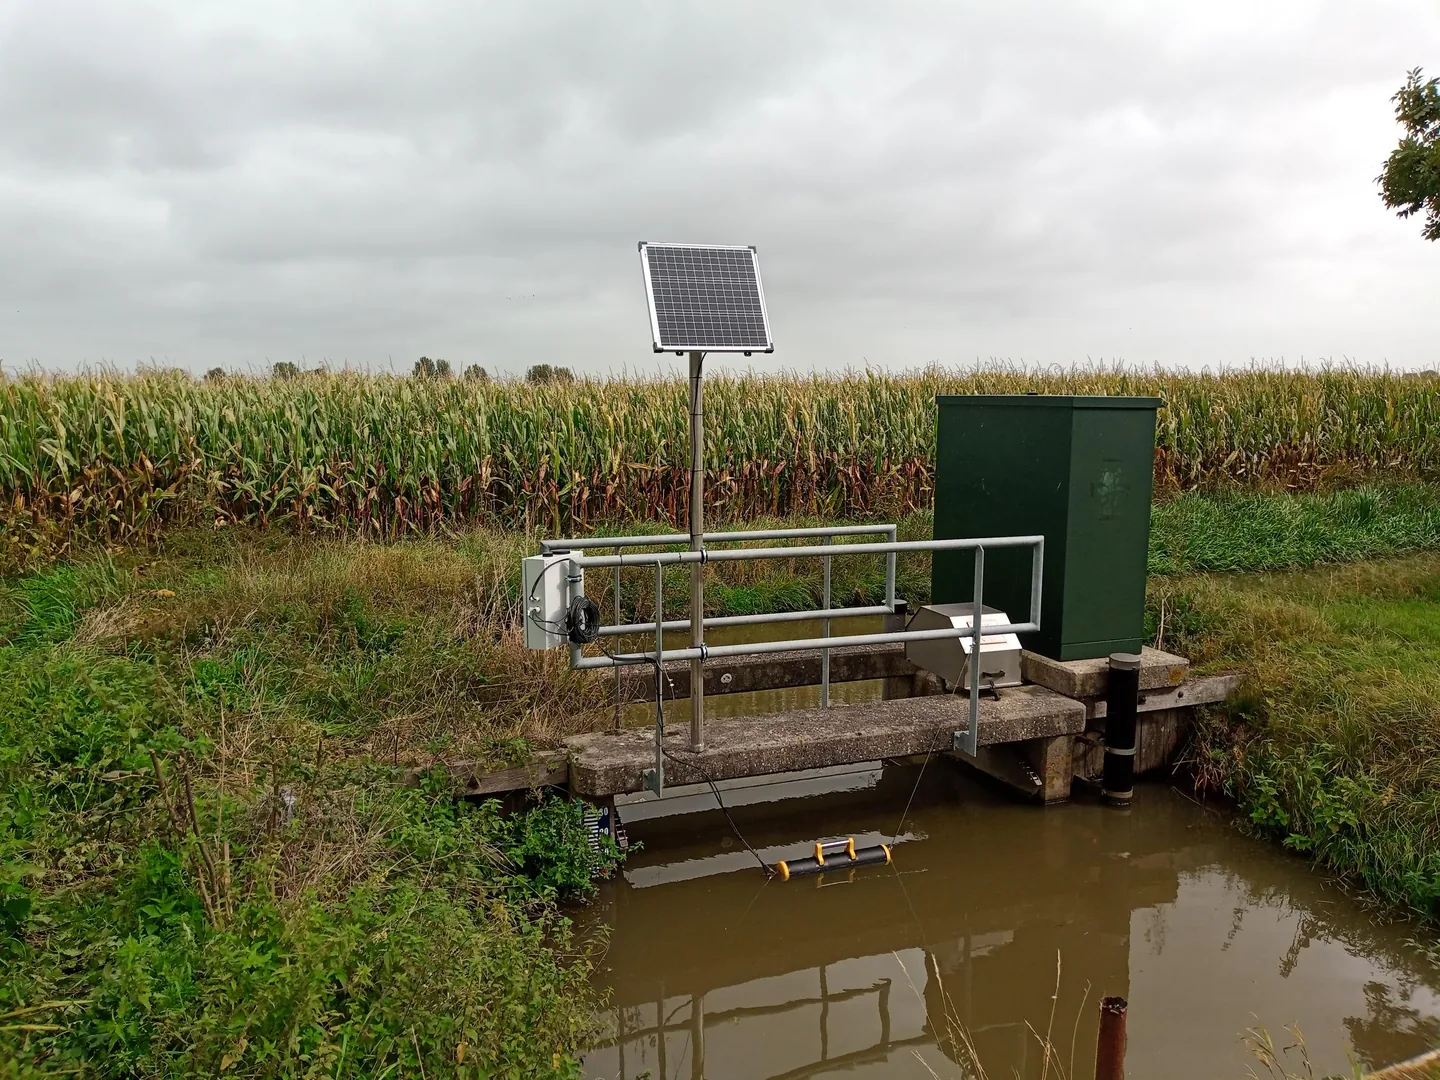
Monitoring station with a solar panel and floating sensor mount at a watercourse.
Start with the logger, sensors or a complete station. We help match the components to your application.
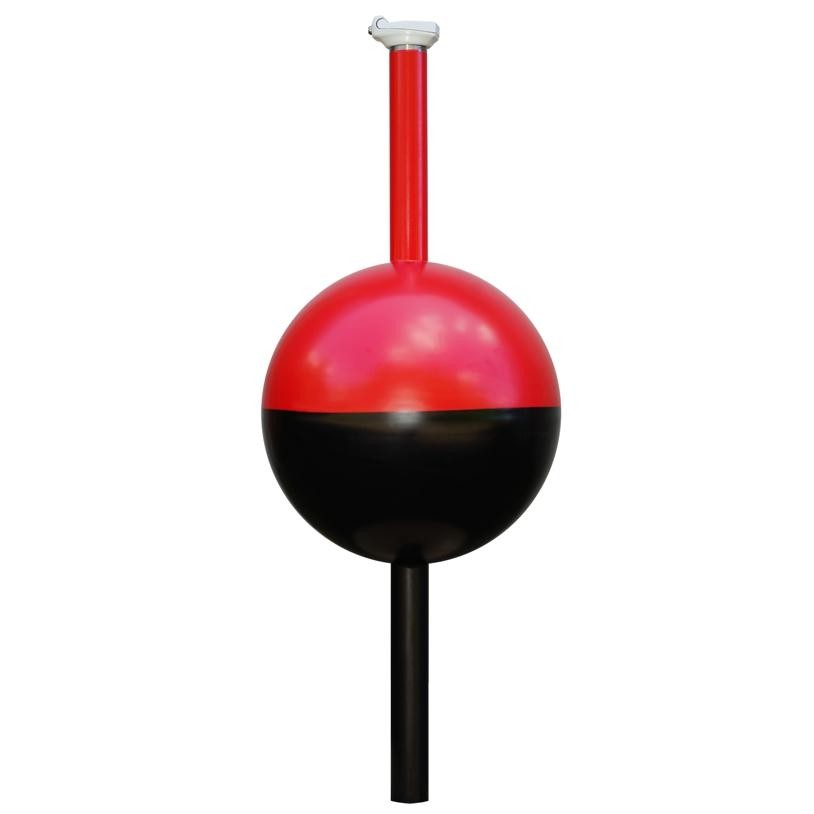
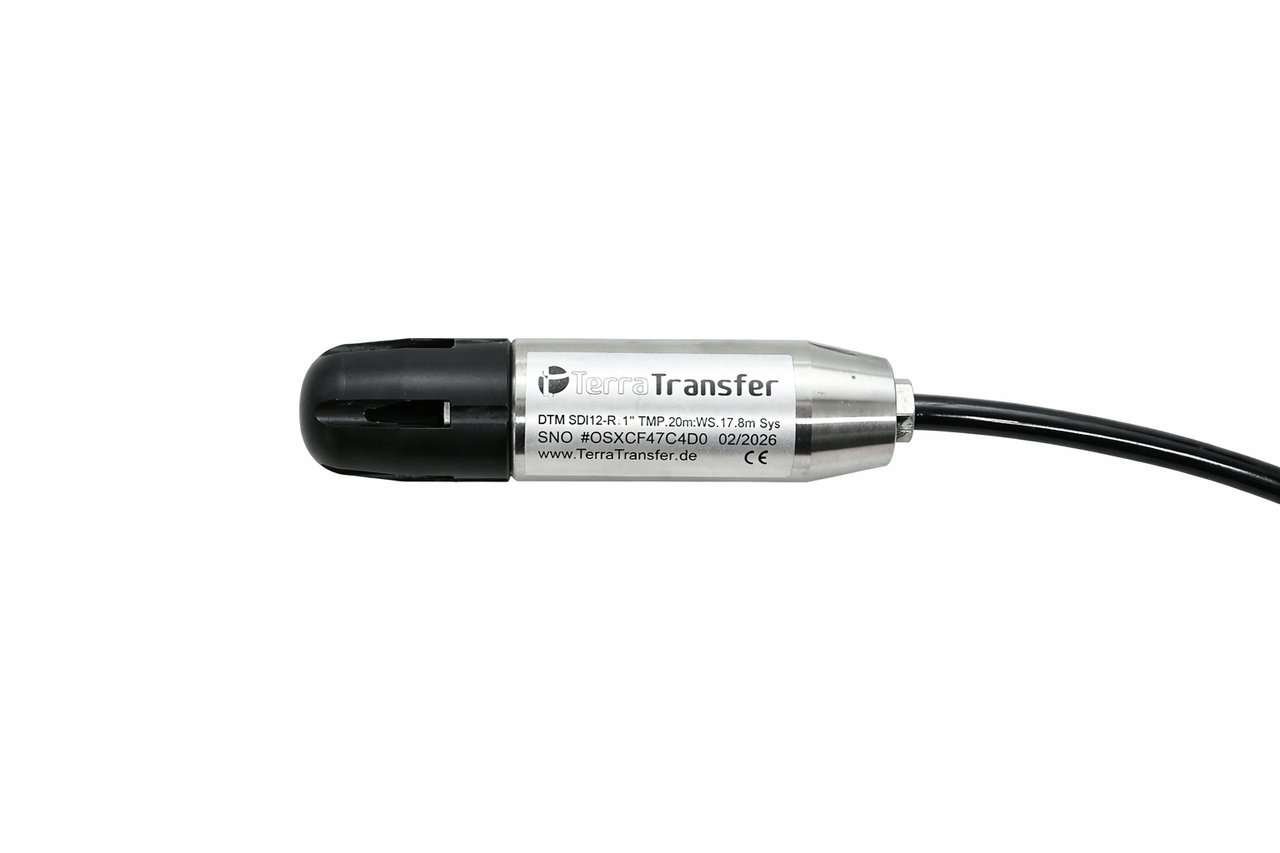
Sensors and interfaces for your chosen parameters and existing equipment.
View product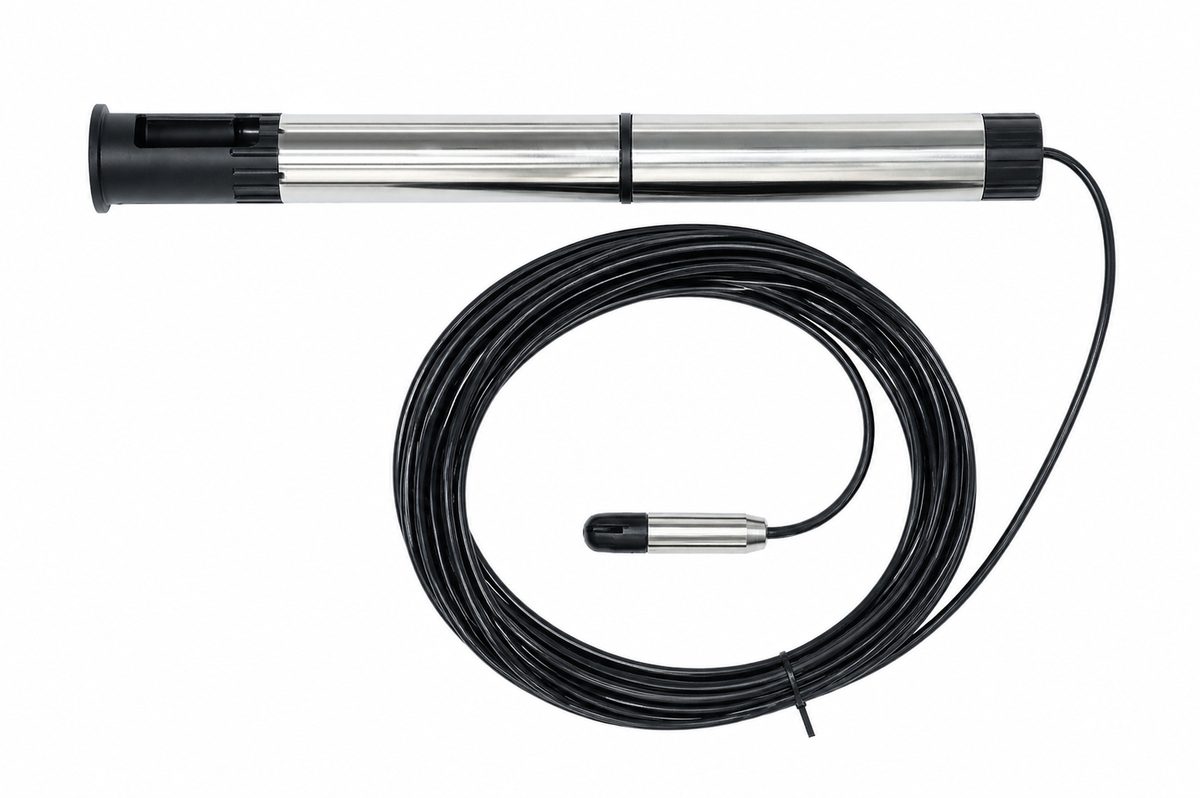
Data logger with mobile transmission for monitoring sites with central data access.
View productMeasurement parameters, installation and methodological notes in detail.
For assessing surface waters under the EU WFD and OGewV, continuous time series give a far more complete picture than the classic grab sample. Multi-parameter sondes on the SDI-12 bus capture the core parameters, complemented by fluorescence sensors for algal early warning. Combined with discharge, substance loads can be computed.
Algal early warning runs via chlorophyll-a and phycocyanin fluorescence, complemented by O₂ day-night variation and turbidity. Important: optical turbidity (NTU/FNU per ISO 7027) is not the same as suspended-sediment concentration (mg/l) — site-specific calibration is mandatory. Load calculations rely on parallel discharge measurement; sediment loads at reservoir inflows in the sense of DIN 19700-11.
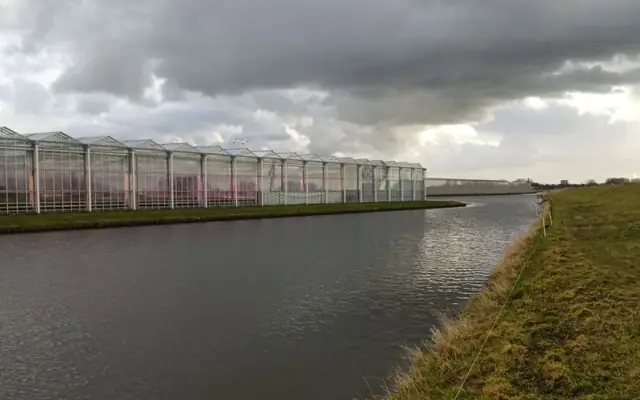 Netherlands: nitrate monitoring at greenhouse drainage ditchesThree sites in the Netherlands: TriOS NICO nitrate probes mounted under floats, connected to Aquatos Web LTX in solar-powered cabinets. Early warning against algal blooms and oxygen depletion — water quality is measurable.
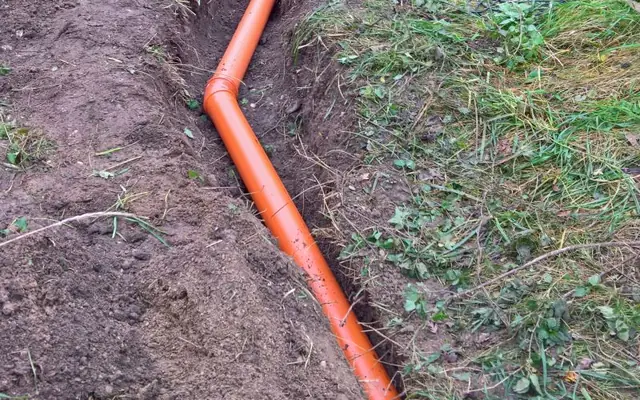 Kommerner Mühlensee: turbidity monitoring at the flood-retention basinThe Erftverband is converting the lake near Mechernich into a flood-retention basin — construction starts summer 2026, expected to take one year. Downstream in the Bleibach an Aquatos station provides continuous turbidity monitoring during the works.
We configure the right multi-parameter sonde and the load calculation for your water body.